
Hamilton County
Market Report
Current real estate statistics for Hamilton County and the six communities I serve across Hamilton and Boone Counties. Updated monthly with the latest available data and market analysis.
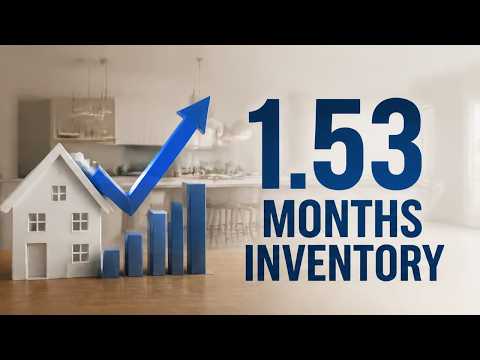
Months of Inventory
Firmly a seller's market
Source: MIBOR · most recent published figure · refreshed monthly
In a seller's market, well-priced homes move fast. Get pre-approved, know your must-haves, and be ready to act when the right home comes to market.
With inventory this tight, pricing realistically from day one and prepping your home well typically draws the strongest interest.
Market Meter updates monthly with fresh local data.
October Market Update
Here are the latest numbers for Hamilton and Boone County. Watch the October update and I'll walk you through what's moving in our market right now.
October 2026 at a Glance
A quick read on last month's numbers across Hamilton and Boone Counties, at a glance.
| Metric | October 2026 |
|---|---|
| Sales | 435 sold, down 8.8% from September and 15.9% year over year (517 a year ago) |
| New listings | 526, down 3.3% month over month and 6.2% year over year (561 a year ago) |
| Total active inventory | 1,073, up 6.8% from September and 13.9% year over year (942 a year ago) |
| Average days on Market | 40, flat year over year |
| Median price | $473,000, off 2.9% from September but up 0.5% year over year ($470,765 a year ago) |
| Price per sq ft | $193, up 1.6% month over month and 4.3% year over year ($185 a year ago) |
| Absorption rate | 2.5 |
The takeaway: buyers have more room to negotiate, but home values are still holding steady year over year.
September 2026 Market Update
September 2026 stats for Hamilton County, Indiana: closed sales, new listings, active inventory, days on market, median price, price per square foot, and absorption rate.
September market update video
Previous Market Updates
Past months' market updates and videos, newest first.
 August 2026 Market Update
County-wide snapshot: ~18 days on market, +20% active inventory, ~$474,900 year-to-date median price, and a ~6.7% 30-year fixed rate.
County-wide snapshot: ~18 days on market, +20% active inventory, ~$474,900 year-to-date median price, and a ~6.7% 30-year fixed rate.
Hamilton County at a Glance
August 2026 data (Hamilton County SFR). Source: MIBOR Market Insights and EverythingHamiltonCounty.com market coverage.
County average, up from about 12 a year ago
Central Indiana supply is near a decade high, roughly 1.2 months county-wide
Highest YTD median in Central Indiana; annual growth cooled to about 2-4%
Early-August average; buydowns and concessions help stretch buying power
Key Takeaways for September 2026
More Choices Than Ever
Active inventory in September 2026 was up roughly 18% from a year ago across Central Indiana, and supply sits near a decade high. Buyers have more selection than they have had in years.
More Time to Decide
Homes took about 42 days on average to sell county-wide in September, up from 39 a year ago, while the metro-level median runs closer to 18 days. That extra time means less pressure and more room to research, compare, and make a confident offer.
Prices Steady, Not Surging
The year-to-date median price sits near $475,000, the highest in Central Indiana, but growth has cooled. Individual communities range from essentially flat to up double digits, a return to balance rather than a downturn.
Rates Near 7.3%
The 30-year fixed rate averaged about 7.32% in the week ending October 22, 2026, roughly a point higher than a year ago. Rate buydowns and seller concessions can stretch buying power, so knowing your number matters more than ever.
Negotiation Is the New Normal
With more inventory and longer marketing times, sellers are increasingly covering closing costs or making repairs to get deals done. In a more balanced market, asking for a concession is not just reasonable, it is smart.
Market Stats for Each City
Detailed metrics for each of the six communities I serve. Compare median prices, days on market, inventory levels, and trends at a glance.
| City | Median Sale Price | YoY Change | Days on Market | Active Inventory |
|---|---|---|---|---|
| Carmel Hamilton County | ~$570,000 | +2.7% | ~14 days | n/a |
| Fishers Hamilton County | ~$435,000 | ~0% | n/a | n/a |
| Noblesville Hamilton County | ~$420,000 | +10.8% | n/a | n/a |
| Westfield Hamilton County | ~$510,000 | +8.9% | 24 days | ~307 |
| Zionsville Boone County | ~$787,000 | +4.7% | n/a | n/a |
| Whitestown Boone County | ~$383,000 | ~0% | n/a | n/a |
Carmel
Carmel is Hamilton County's premier market, with a median sale price near $570,000 for the three months ending September 2026, up 2.7% year over year, and homes typically under contract in about 14 days. The Arts & Design District, top-ranked schools, and a growing mix of townhomes and maintenance-free options keep demand steady, and this fall buyers have more choices than they did a year ago.
Fishers
Fishers is essentially flat year over year, with MLS-based and Redfin readings landing near $430,000 to $435,000 through September 2026. The Nickel Plate District, Geist-area homes, and strong schools keep the market liquid, and buyers now have noticeably more inventory to compare than they did a year ago. It is one of the county's most balanced, active markets.
Noblesville
Noblesville posted the county's strongest year-over-year gain this fall: Redfin's September 2026 reading put the median sale price at $419,800, up 10.8% from a year earlier. The historic downtown Square, Morse Reservoir, and expanding neighborhoods keep demand healthy, and a townhome median near $340,000 gives downsizers a more attainable entry point.
Westfield
Westfield keeps climbing, with the median near $510,000 as of September 2026, up 8.9% year over year, about 307 active listings, and homes taking roughly 24 days to sell. New construction and demand near Grand Park Sports Campus continue to fuel one of the county's fastest-growing markets.
Zionsville
Zionsville remains the region's premier luxury market, with a September 2026 median near $787,000 for all home types, up 4.7% year over year. Brick-paved Main Street, top-rated schools, and historic estates keep supply tight, and a townhome median near $362,000 offers a lower-maintenance way into the village lifestyle.
Whitestown
Whitestown is the area's most attainable entry point, with a September 2026 median near $383,000, essentially flat year over year (sources range from about a 1% gain to a 1% dip). New construction along the I-65 corridor keeps adding supply, which is welcome news for first-time buyers and investors.
Figures reflect the most recent available data as of September 2026, compiled from Redfin city market pages, MIBOR and Indiana REALTORS market data, F.C. Tucker Company's Market Watch, and local MLS estimates. Metrics can vary by source, reporting window, and home type. For example, Redfin's Carmel median includes all home types and runs higher than single-family-only estimates. City-level days on market and active inventory are not published for every community, so those cells are marked n/a where the current data does not break them out.
Condos & Townhomes
Dedicated condo and townhome medians are published at the metro level rather than as monthly per-city breakouts for most of these communities. Where available, the latest rolling medians are below.
| Community | Condo / Townhome Median | Notes |
|---|---|---|
| Indianapolis Metro, condos | ~$225,000 | 12-month rolling median, Homes.com, down about 3% year over year |
| Indianapolis Metro, townhomes | ~$324,000 | 12-month rolling median, Homes.com, down about 4% year over year |
| Carmel, townhomes | ~$430,000 | 12-month rolling median, Homes.com |
| Noblesville, townhomes | ~$340,000 | 12-month rolling median, Homes.com |
| Zionsville, townhomes | ~$362,000 | 12-month rolling median, Homes.com |
| Whitestown, townhomes | ~$310,000 | 12-month rolling median, Homes.com |
| Fishers & Westfield | n/a | City-level condo and townhome medians are not published separately in the current data |
Condo and townhome medians are 12-month rolling figures from Homes.com market data, the latest available for these communities. MIBOR does not publish monthly per-city condo breakouts. If you are shopping for a condo or townhome, ask Susan for a current, neighborhood-specific comparison drawn from live MLS data.
What the Numbers Mean for Each City
Every market tells a story. Here's what the current data signals for buyers and sellers in each community.
Carmel
+2.7% YoYCarmel is Hamilton County's premier market, with a median sale price near $570,000 for the three months ending September 2026, up 2.7% year over year, and homes typically under contract in about 14 days. The Arts & Design District, top-ranked schools, and a growing mix of townhomes and maintenance-free options keep demand steady, and this fall buyers have more choices than they did a year ago.
Fishers
~0% YoYFishers is essentially flat year over year, with MLS-based and Redfin readings landing near $430,000 to $435,000 through September 2026. The Nickel Plate District, Geist-area homes, and strong schools keep the market liquid, and buyers now have noticeably more inventory to compare than they did a year ago. It is one of the county's most balanced, active markets.
Noblesville
+10.8% YoYNoblesville posted the county's strongest year-over-year gain this fall: Redfin's September 2026 reading put the median sale price at $419,800, up 10.8% from a year earlier. The historic downtown Square, Morse Reservoir, and expanding neighborhoods keep demand healthy, and a townhome median near $340,000 gives downsizers a more attainable entry point.
Westfield
+8.9% YoYWestfield keeps climbing, with the median near $510,000 as of September 2026, up 8.9% year over year, about 307 active listings, and homes taking roughly 24 days to sell. New construction and demand near Grand Park Sports Campus continue to fuel one of the county's fastest-growing markets.
Zionsville
+4.7% YoYZionsville remains the region's premier luxury market, with a September 2026 median near $787,000 for all home types, up 4.7% year over year. Brick-paved Main Street, top-rated schools, and historic estates keep supply tight, and a townhome median near $362,000 offers a lower-maintenance way into the village lifestyle.
Whitestown
~0% YoYWhitestown is the area's most attainable entry point, with a September 2026 median near $383,000, essentially flat year over year (sources range from about a 1% gain to a 1% dip). New construction along the I-65 corridor keeps adding supply, which is welcome news for first-time buyers and investors.
Key Metrics Explained
Median Sale Price
The midpoint of all home sale prices in a given area. Half of homes sold for more, half sold for less. This is generally more reliable than average price, which can be skewed by a few very high or low sales.
Days on Market (DOM)
The average number of days from when a property is listed to when it goes under contract. Lower DOM typically indicates strong buyer demand; higher DOM may signal more negotiating power for buyers.
Active Inventory
The total number of homes currently listed for sale in a given area. Rising inventory gives buyers more options, while low inventory can create competitive bidding situations.
Months of Supply
How long the current inventory would last at the current sales pace. Under 4 months is generally a seller's market; 4-6 months is balanced; over 6 months favors buyers.
Data Sources & Disclaimer
Market data is compiled from publicly available sources including Redfin city and county market reports (September 2026), MIBOR and Indiana REALTORS market data, F.C. Tucker Company's Market Watch (September 2026), Homes.com market data for condo and townhome medians, and Freddie Mac's Primary Mortgage Market Survey for mortgage-rate figures. County-level figures represent the most recent available data as of October 24, 2026. Figures are approximate and may vary by neighborhood, property type, and reporting window. Active inventory counts and days on market are snapshots and change frequently. Where MIBOR publishes condo and townhome medians only at the metro level, per-city condo figures are marked n/a in this report.
For a personalized market analysis of your specific property or neighborhood, contact Susan Roberts or schedule a consultation.
Want a personalized market analysis?
Whether you're buying, selling, or just curious about your home's current value, I provide data-driven insights tailored to your specific situation.